Toronto’s Transit Crisis Is a Class Crisis
The rich are ride-hailing their way out of public transit, draining fare revenue from the system. It’s another instance of the accelerating economic segregation of the public sphere.
Toronto households now spend more than $440 million a year on Uber and Lyft. High-income riders are spurring the shift, relying on the service of drivers earning less than $6 an hour. (David Paul Morris / Bloomberg via Getty Images)
Toronto households spent more than CA$440 million on ride-hailing services like Uber and Lyft in 2023 — just over half of what they spent on public transit. Among households earning $200,000 or more, spending on ride-hailing has surpassed spending on transit: $146 million to $118 million.
That finding captures something larger than a shift in transportation preferences. It is evidence of a class exit from the public commons, one that is accelerating the fiscal decline of the city’s public transit provider, the Toronto Transit Commission (TTC), while enriching a ride-hailing industry whose drivers earn a median of less than $6 an hour after expenses.
It is evidence of an increasing economic segregation of the public sphere, mirroring the scandalous rise of private inequality. With a possible provincial takeover of ride-hailing regulation, the City of Toronto may have missed a decade-long opportunity to act.
The Post-COVID Transit Gap
Five years after the onset of the pandemic, public transit across North America has not fully recovered — but Toronto’s situation is notably worse than its peers. In the United States, ridership hit 85 percent of pre-pandemic levels by early 2025, buoyed by return-to-office mandates. Vancouver’s TransLink has recovered roughly 90 percent of its pre-pandemic riders.
The TTC, by contrast, is moving in the wrong direction. It projected just 414 million rides in 2025, down from 421 million the year before. As of October 2025, ridership stood at 78 percent of pre-pandemic figures. Work-from-home and transit service issues explain part of this gap. But what explains the rest, and why is Toronto’s deficit so much deeper than its peers?
Ride-hailing is everywhere in North America. But Toronto’s ride-hailing market is uniquely oversaturated, with about 80,000 licensed ride-hailing drivers — comparable in absolute number to New York City. This means there are more than three times as many ride-hailing vehicles per capita in Toronto than in NYC (Toronto ≈ 2.8 million residents; NYC ≈ 8.5 million). This is not accidental. New York capped such vehicles in 2018 and imposed a minimum driver pay formula. Vancouver, which only permitted ride-hailing in 2020, has also imposed supply constraints; both have recovered transit ridership faster than Toronto. In both cities, the cap came before the transit recovery.
Toronto, meanwhile, has never regulated ride-hailing supply, despite having controlled taxi supply for decades. When Uber entered the city illegally in 2014, the response was legalization without meaningful limits. In October 2023, a newly elected Mayor Olivia Chow moved to freeze ride-hailing licenses. Uber sued, alleging the process was not procedurally sound; two months later, Toronto City Council rescinded the cap entirely.
A yearlong staff review and public consultation produced a comprehensive report in November 2024 recommending a cap, but at the Executive Committee meeting, even this was referred back to staff, including a request to elicit “recommendations for the Province of Ontario to inform a regional approach to vehicle-for-hire licensing.”
Toronto was not alone. Across the province, smaller municipalities were already demanding the same outcome the industry wanted. The mayor of Brighton in Eastern Ontario said the quiet part out loud, citing ride-hailing industry preferences: “What our friends at Uber and Lyft say is let’s just get the same regulations from Windsor to Cornwall and up to Sault Ste. Marie and call it a day.”
Who Rides, Who Pays
The spending data tells a story of class. Toronto’s wealthiest households now spend more on Uber and Lyft than on the TTC. This finding is based on a custom data request of household expenditure data from Statistics Canada, the only public source that captures the socioeconomic profile of ride-hailing users.
Figure 1 shows annual household expenditure on public transit and ride-hailing across three income bands in Toronto in 2023. The 58 percent of households earning under $100,000 spent roughly $460 on transit and $200 on ride-hailing — for them, transit dominates. The 28 percent earning between $100,000 and $199,999 spent approximately $800 on transit and $365 on ride-hailing — transit still leads, but the gap narrows. Among the 14 percent earning $200,000 and above, the relationship flips: spending on ride-hailing reached approximately $780 per household, overtaking transit spending of roughly $630.
Figure 1
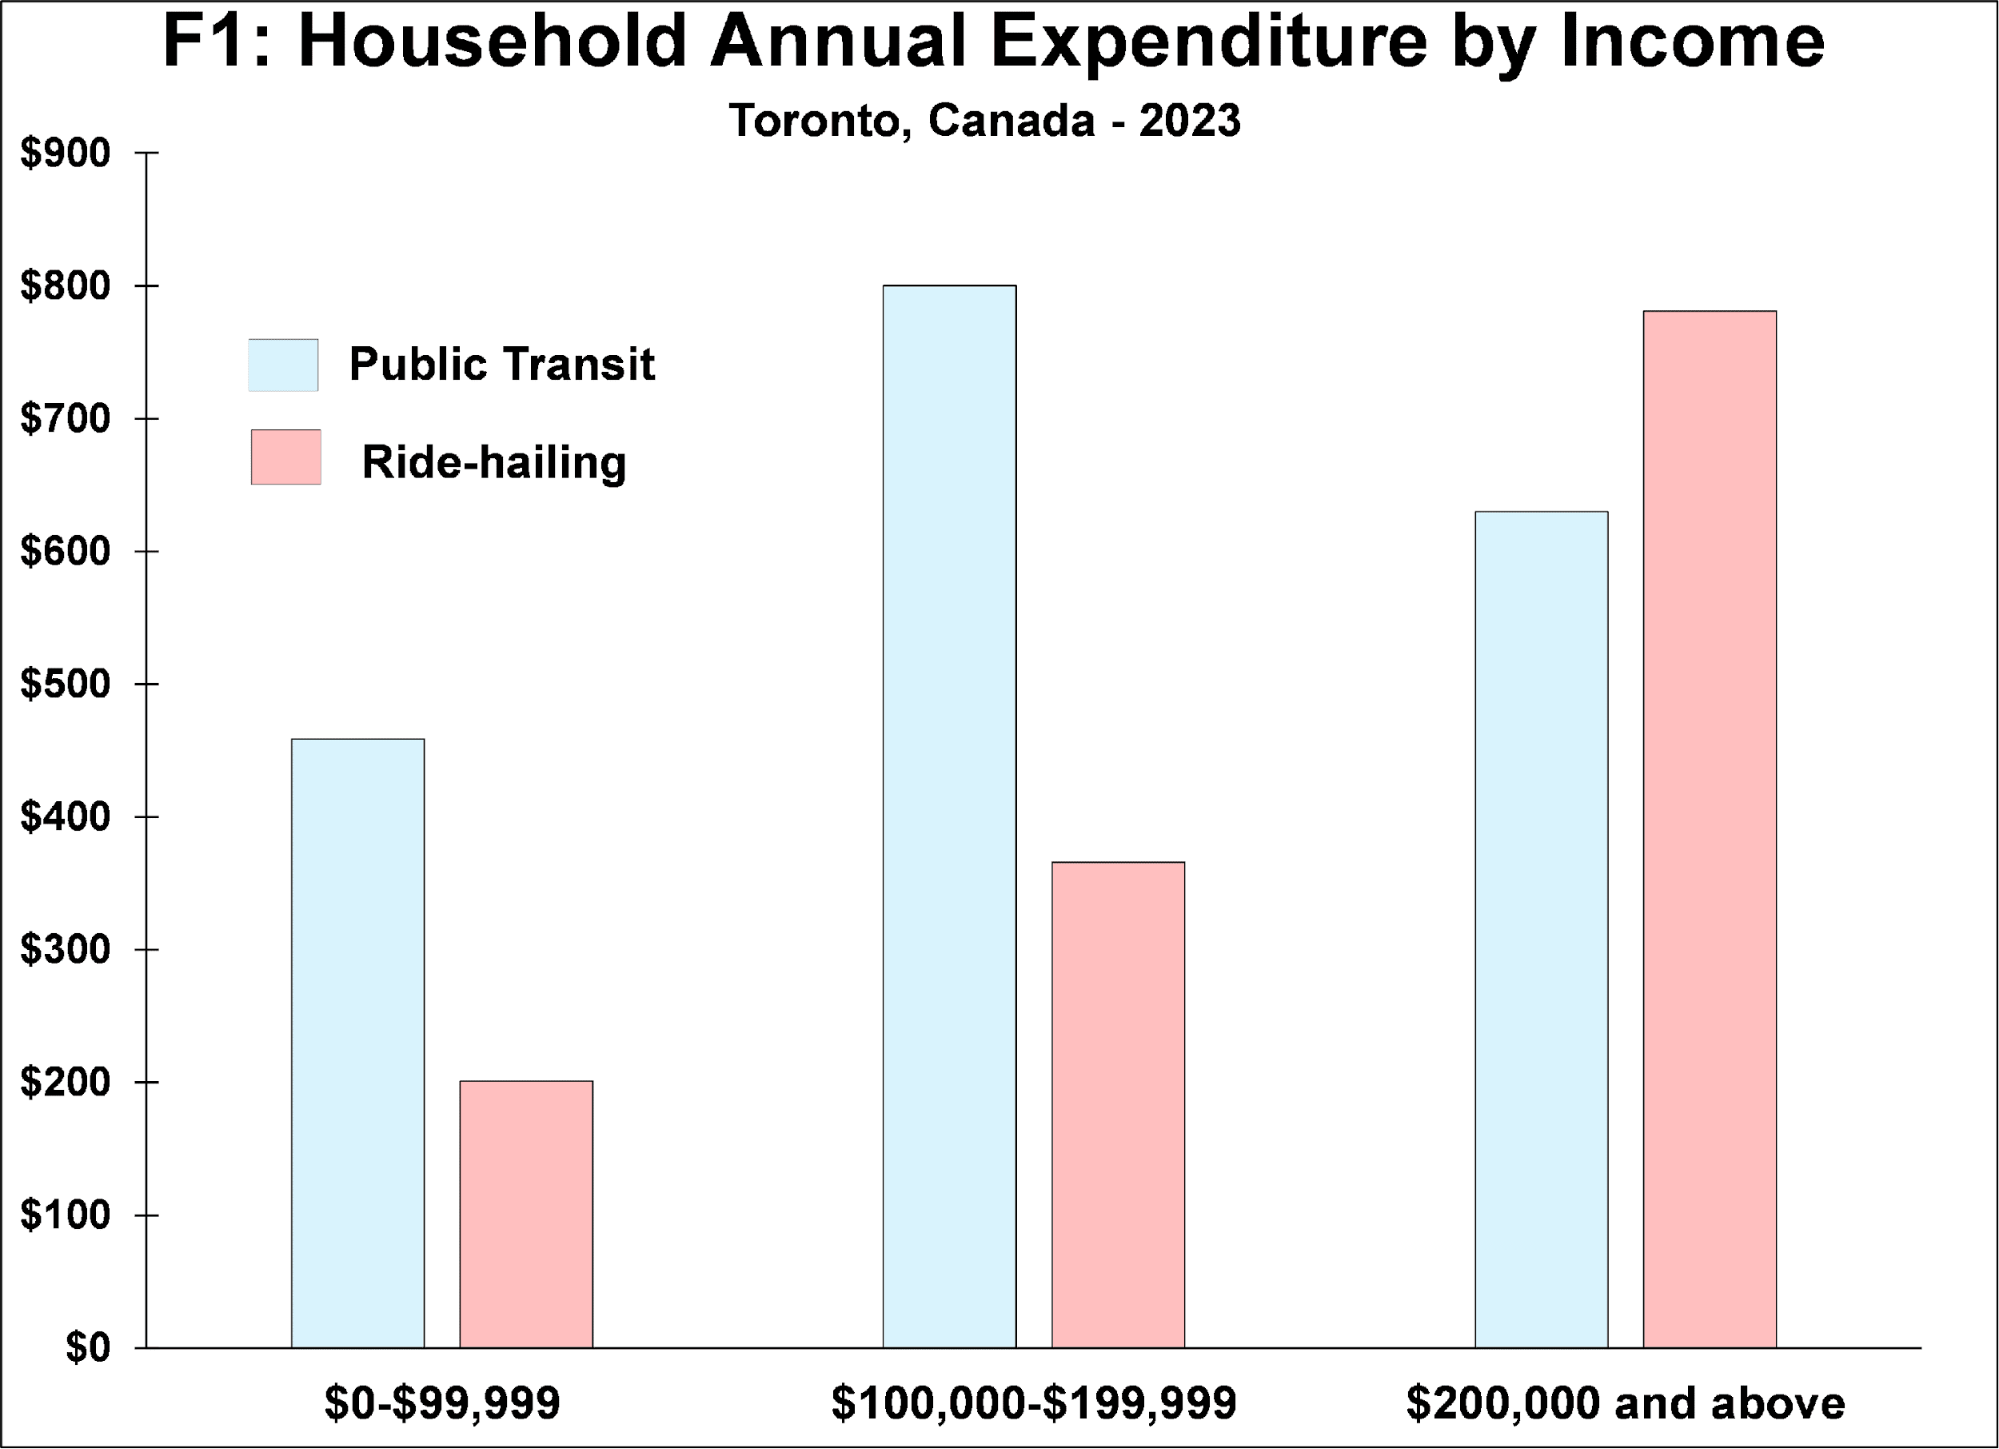
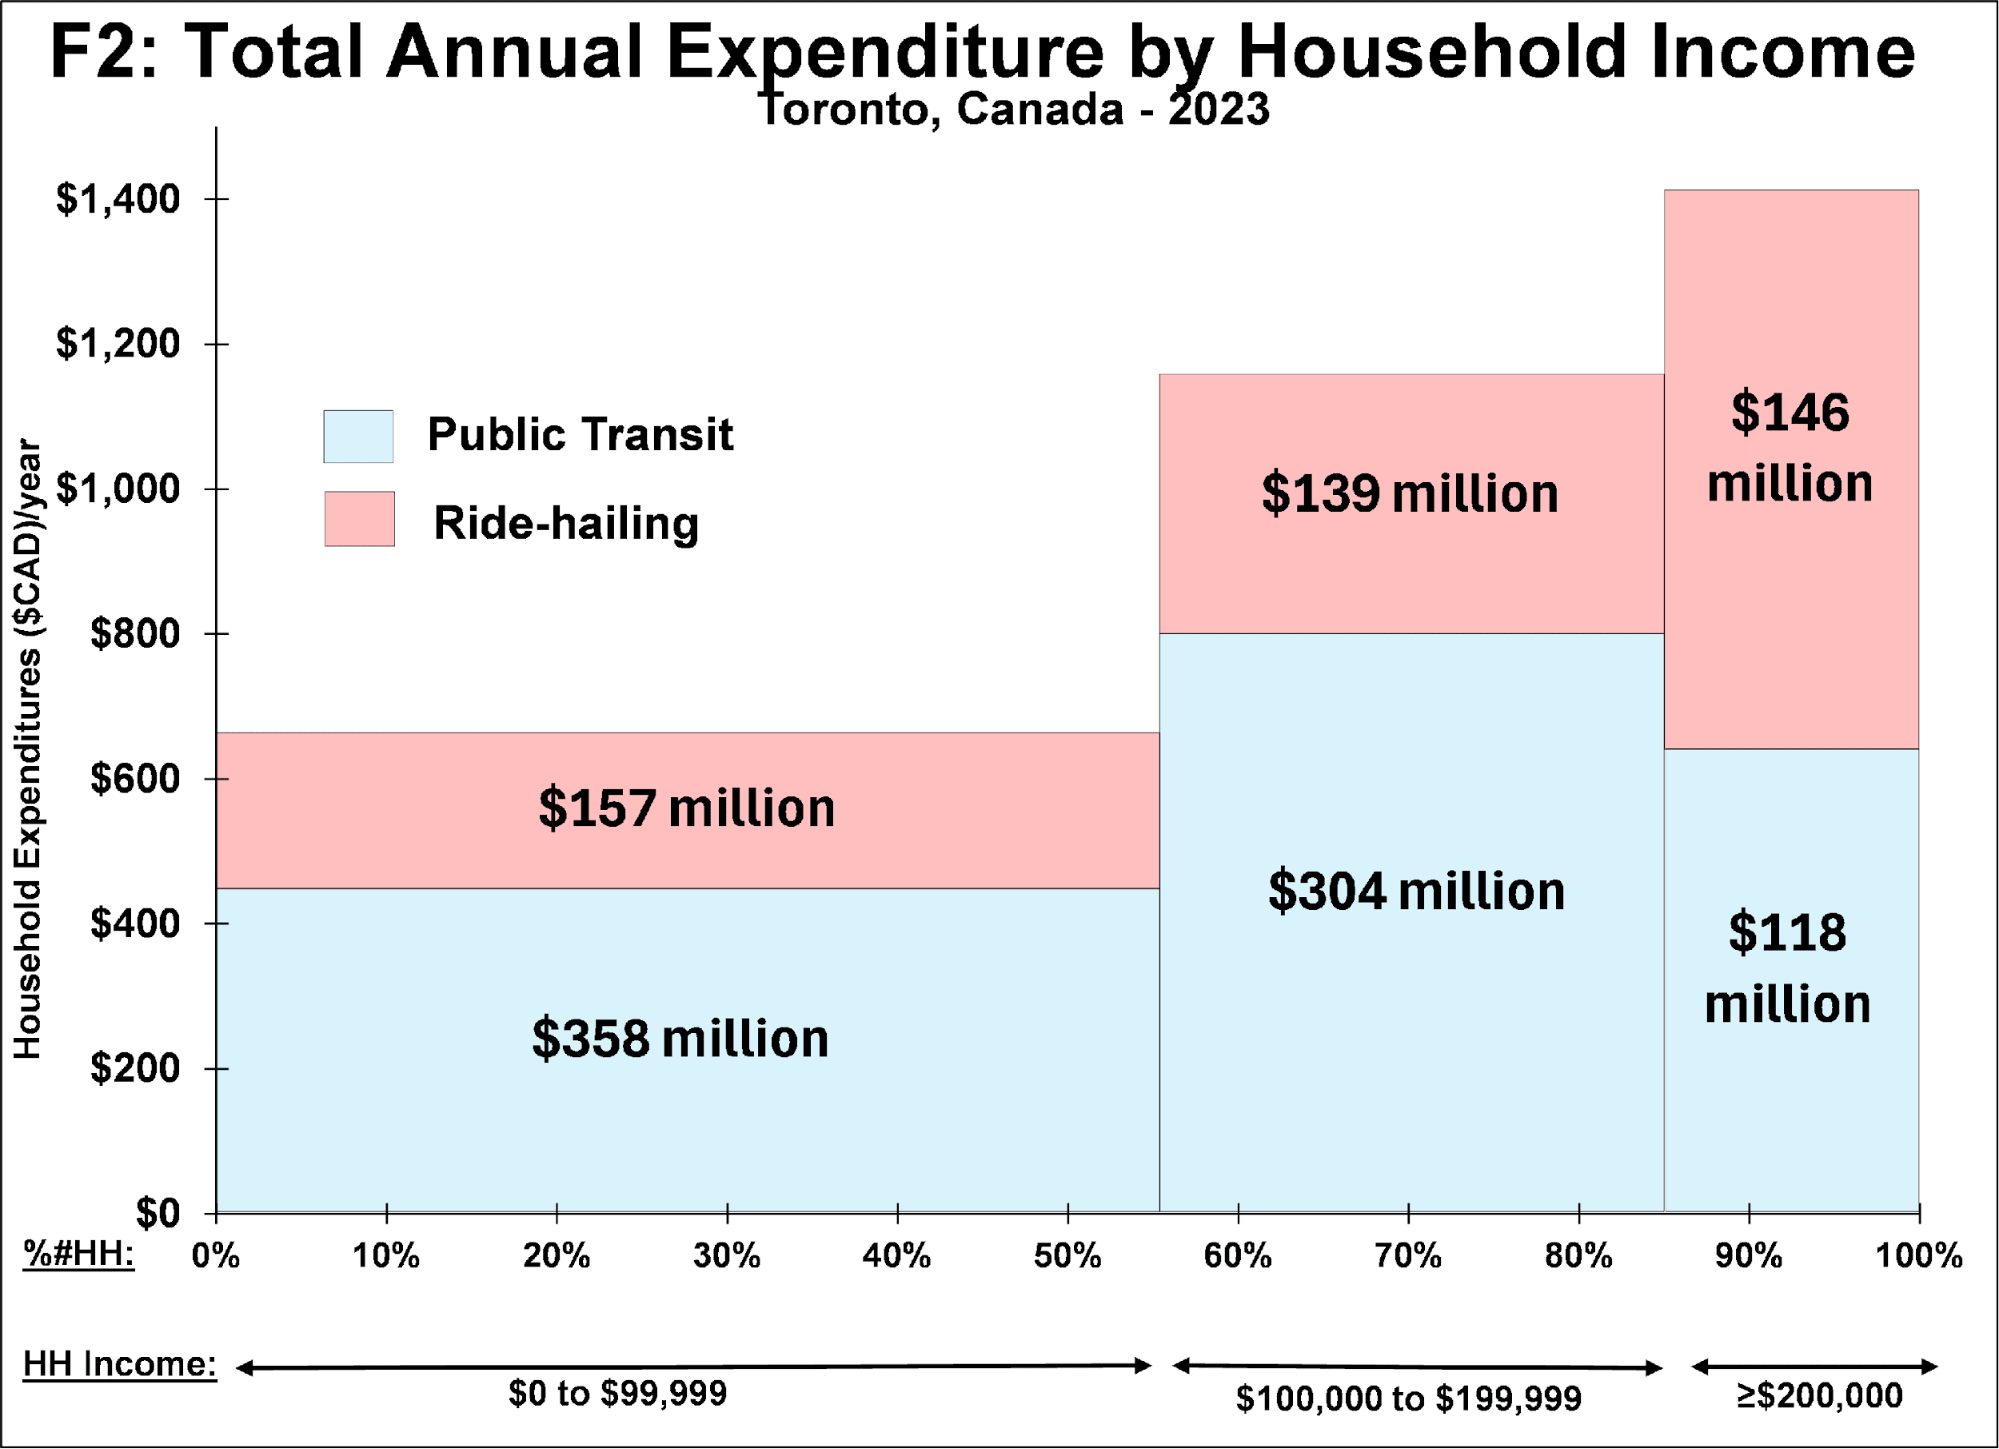
Figure 2 reveals the aggregate scale. Those earning under $100,000 collectively spent $358 million on transit and $157 million on ride-hailing, while those households earning above $200,000 spent just $118 million on transit but $146 million on ride-hailing. High-income Toronto has effectively shifted its transportation dollars from the public system to the private one. Across all income groups, the ride-hailing market now exceeds $440 million annually — more than half of the city’s $780 million transit spending.
The high-income flight from transit is new. While Toronto-specific data for previous years was not included in the custom data request, available provincial data indicates that in 2019 the 20 percent highest-income Ontarians spent much more on transit than on ride-hailing, but that by 2023 it was the same, increasing ride-hail spending by about $90 per household and decreasing transit expenditures by a staggering $300 per household.
Figure 2
This is not simply a consumer preference story. It is a system in which the wealthiest households purchase a private alternative to public transit — served by a workforce earning a median net wage of $5.97 per hour, well below the $17.20 minimum wage. High-income riders exit the public commons; low-wage workers, many of them recent immigrants who make up over 70 percent of the ride-hail driver workforce, deliver the service and absorb the risk. The transit “death spiral” — lower ridership, lower fare revenue, service cuts, further ridership loss — is being accelerated by a privatized system that transfers wealth upward and risk downward.
Every trip that migrates from the TTC to Uber or Lyft is also a trip that could have been provided by a unionized operator earning a living wage, with benefits and a pension, instead of by a misclassified “independent contractor” paid below minimum wage. As more of the city’s mobility budget flows to nonunion platforms, public agencies lose both fare revenue and the political leverage that comes from a large, organized workforce.
Because it is survey-based, household expenditure data from Statistics Canada likely understates total revenue. The TTC reported $943 million in fare revenue from all riders — about 20 percent more than the $780 million reported above, a gap partly explained by commuters from the larger Greater Toronto Area and by tourists. Comparable systemwide data for ride-hailing is not publicly available because neither the city nor the ride-hailing industry collects or reports Toronto revenue numbers, but these are also likely higher than survey-based estimates.
What matters is that this approach makes something visible that proprietary industry data keeps obscure. Much of the existing research relies on nonreplicable data supplied by ride-hailing companies to “congenial” economists to help spin industry-friendly narratives that ignore or obscure class analysis.
Two Regulatory Instruments, One Problem
The data above points toward two distinct, class-based policy instruments. A vehicle cap below the current unregulated numbers would have the largest transit-recovery through middle-income households, who currently use both modes and would respond to a slightly less abundant ride-hailing market by making more trips on transit. A cap would likely not recover the highest-income households for the TTC; they have already exited. Lower-income households, who use ride-hailing the least, benefit from a better-funded transit system, protected from transit service revenue cuts that flow from high-income exit.
The second instrument is a ride-hail levy. In 2019, New York State – not New York City – used its tax authority to enact a US$2.75 per Uber/Lyft trip levy in the Manhattan core, with the proceeds flowing to the Metropolitan Transit Authority, the transit agency that serves the NYC area. That levy now generates more than $300 million a year, drawn largely from higher-income riders who use ride-hailing the most. Like NYC before Albany acted, Toronto can charge only cost-recovery administrative fees — about $20 million a year — not a true revenue-generating levy. A provincial takeover of ride-hailing would therefore open a legislative path to a transit-recovery ride-hail levy in Toronto’s core, dedicated to the TTC, alongside a hard vehicle cap.
Toronto’s municipal election is scheduled for October 2026. Candidates will inherit a transit system in structural decline, competing for riders with a ride-hailing industry that operates with no supply constraints, no price regulation, and no obligation to account for public costs.
Other cities have demonstrated that regulation works. Toronto’s November 2024 staff report was a step in the right direction. Instead, the mayor’s Executive Committee punted the issue and signaled to the province that it could take it up.
That does not mean the city’s voice is spent. Municipal candidates should put their regulatory preference on the record — publicly committing to a vehicle cap and a provincially legislated transit-recovery ride-hailing levy — even if the province moves to strip Toronto’s ability to regulate ride-hailing locally. If Toronto is to lose control over ride-hailing, the province must at least accept responsibility for making that industry help pay to rebuild the public transit system the industry helped to erode.