The Left Needs to Rethink How It Handles Inequality
Redistributing income alone is unlikely to solve America’s vast inequalities. Workers need and want more power in their workplace and for the state to weaken the influence that corporations have over their lives.
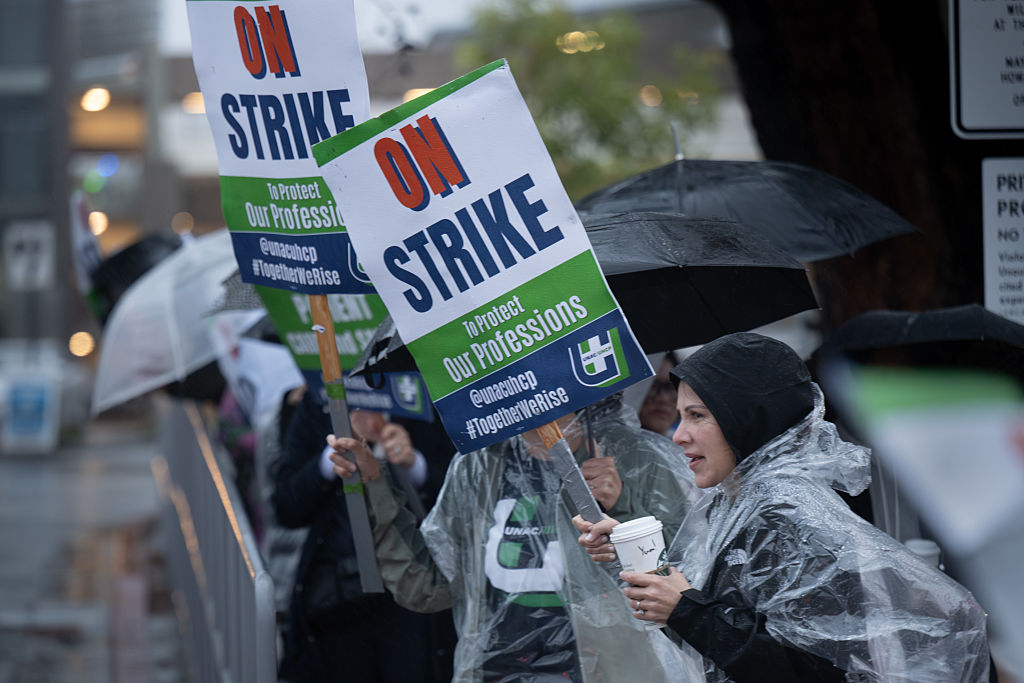
Changing the predistribution of incomes requires policies that, for instance, strengthen unions, set minimum wages, reduce monopoly power, or publicly provide goods and services. (David Crane / MediaNews Group / Los Angeles Daily News via Getty Images)
Incomes in the United States are more unequal than in any other rich country. One common explanation for why is that America doesn’t do much redistribution: tax rates on the highest earners are at historical lows, and the US welfare system is means-tested and full of holes. But another explanation — perhaps a less common one — is that the real problem is the incomes people make before redistribution.
This distinction is not merely academic — it is politically important. Answering one way or the other alters the target of a politics aiming to tackle inequality. If we want to reduce inequality with redistribution, we have to tax and provide social benefits at different rates and in different ways. But if we want to change the predistribution of income, we have to alter something about the way prices and wages are set in the first place. Changing the predistribution of incomes requires policies that, for instance, strengthen unions, set minimum wages, reduce monopoly power, or publicly provide goods and services. These are reforms that directly affect prices and wages — not least because they alter the balance of power between workers and bosses, or between labor and capital.
The distinction between redistribution and predistribution also matters in political debate. The American right has found success fomenting and exploiting anti-redistributive sentiment. But its current electoral appeal seems to come at least in part from some implicitly predistributionary policies. Donald Trump’s tariffs, for example, are popular because supporters see them as intended to provide better jobs for low-income American workers. Similarly, his attacks on elite universities play well because people view these institutions as perpetuating an unfair predistribution of incomes. (And one academic study, which I’ll discuss below, confirms that this isn’t a new phenomenon.)
To orient ourselves, it’s worth asking: What do pre- and redistribution look like in the United States? I think the data tells a pretty simple story. The US is indeed far more unequal in terms of posttax, posttransfer incomes than any other rich country. But this is largely because of extreme predistributional inequality. Perhaps surprisingly, the United States redistributes a somewhat “normal” amount for a rich country. American income redistribution is comparable to Germany and Belgium, two countries with less inequality than the US. What makes the United States unique is just how unequal our incomes are before redistribution.
Those of us who care about inequality should bear these facts in mind — and we should focus more on intervening in the predistribution of incomes. To understand why this shift in thinking is important, we should first get clear about what pre- and posttax inequality looks like, in the United States and around the world.
Pre- and Posttax Incomes in the US
To get a sense of how the US tax and transfer system works, we can distinguish between four distinct types of income.
- “Factor income” is income that comes either from labor (most of us) or from renting capital (landlords or people who own financial assets). We can think of this crudely as the income that people get “from the market.”
- “Pretax income” is factor income, plus any pension income (whether from private pensions or social security).
- “Posttax disposable income” is how much money is left after people pay taxes to and receive any cash benefits from the government.
- “All posttax income” is posttax disposable income, plus the monetary value of noncash (“in-kind”) transfers from the government. These include the value of Medicare and Medicaid, food stamps, and housing vouchers, as well as the value of things like public schools and public infrastructure.
Figure 1 shows the evolution of each of the four types of income over time in the United States, across the distribution. (To account for inflation, I measure incomes in the equivalent of 2024 dollars.) The left panel shows that for the bottom 50 percent of Americans, “market incomes” have been flat since 1973 (the pink line). The average person in the bottom half of the income distribution made just $19,000 per year in wages in 1973 (again, measured in 2024 dollars); a half-century later, the analogous person makes the same amount.

This is an average among all adults with below-median incomes. This means that it includes those who are unemployed or retired and have no “market” income. When we include the pension incomes of retired people, we see that average total “pretax” incomes in the bottom half have grown, but only very slightly, from $21,000 in 1973 to $24,000 in 2023 (the blue line).
How does redistribution affect these incomes? In terms of money that people actually have available to spend, only modestly. Posttax disposable income for the bottom 50 percent has grown from $19,000 to $26,000 over the last half century (the orange line). And posttax disposable income generally looks pretty close to pretax income.
In contrast, Figure 1 makes clear that most of the posttax income growth at the bottom has been due to the increasing value of noncash transfers — the bulk of which has come in the form of Medicaid and Medicare. (Food stamps and housing vouchers are also included here, but they make up a much smaller share than health care transfers.) When the value of these transfers is included, average posttax incomes for the bottom 50 percent of Americans have gone up from $26,000 in 1973 to $38,000 today (the green line).
This clarifies a key fact about redistribution in the United States. Measures that move income from the rich to the poor operate largely through noncash transfers. Our system redistributes income to the bottom 50 percent primarily by providing some people with health care — not by providing them with more cash.
The second two panels show average incomes for people in the “upper-middle 40 percent” of the income distribution, and for those in the top 10 percent. The average person in the upper-middle 40 percent has seen some income growth since 1973: pretax incomes have risen from about $60,000 to about $90,000.
The tax system appears to leave these incomes unchanged — posttax income is roughly equal to pretax (and factor) income. But this masks two effects: these people pay taxes and end up with an average of $80,000 in disposable income after taxes. They then receive roughly all of that back via in-kind transfers (which for these people includes primarily the value of public services).
For the average person in the top 10 percent of the distribution, incomes have more than doubled. (And as is well documented and, in some places, well discussed, incomes have risen even more rapidly for people even further up the distribution.)
To summarize income inequality with one simple measure, we can ask how much more someone in the top 10 percent makes than someone in the bottom 50 percent. That is, we can divide average incomes in the top 10 percent by those in the bottom 50. Figure 2 shows this ratio for each of the four types of income. In 1973, the “market incomes” of the rich were almost ten times higher than those of people in the bottom half. In 2023, their market incomes were over twenty-three times higher.
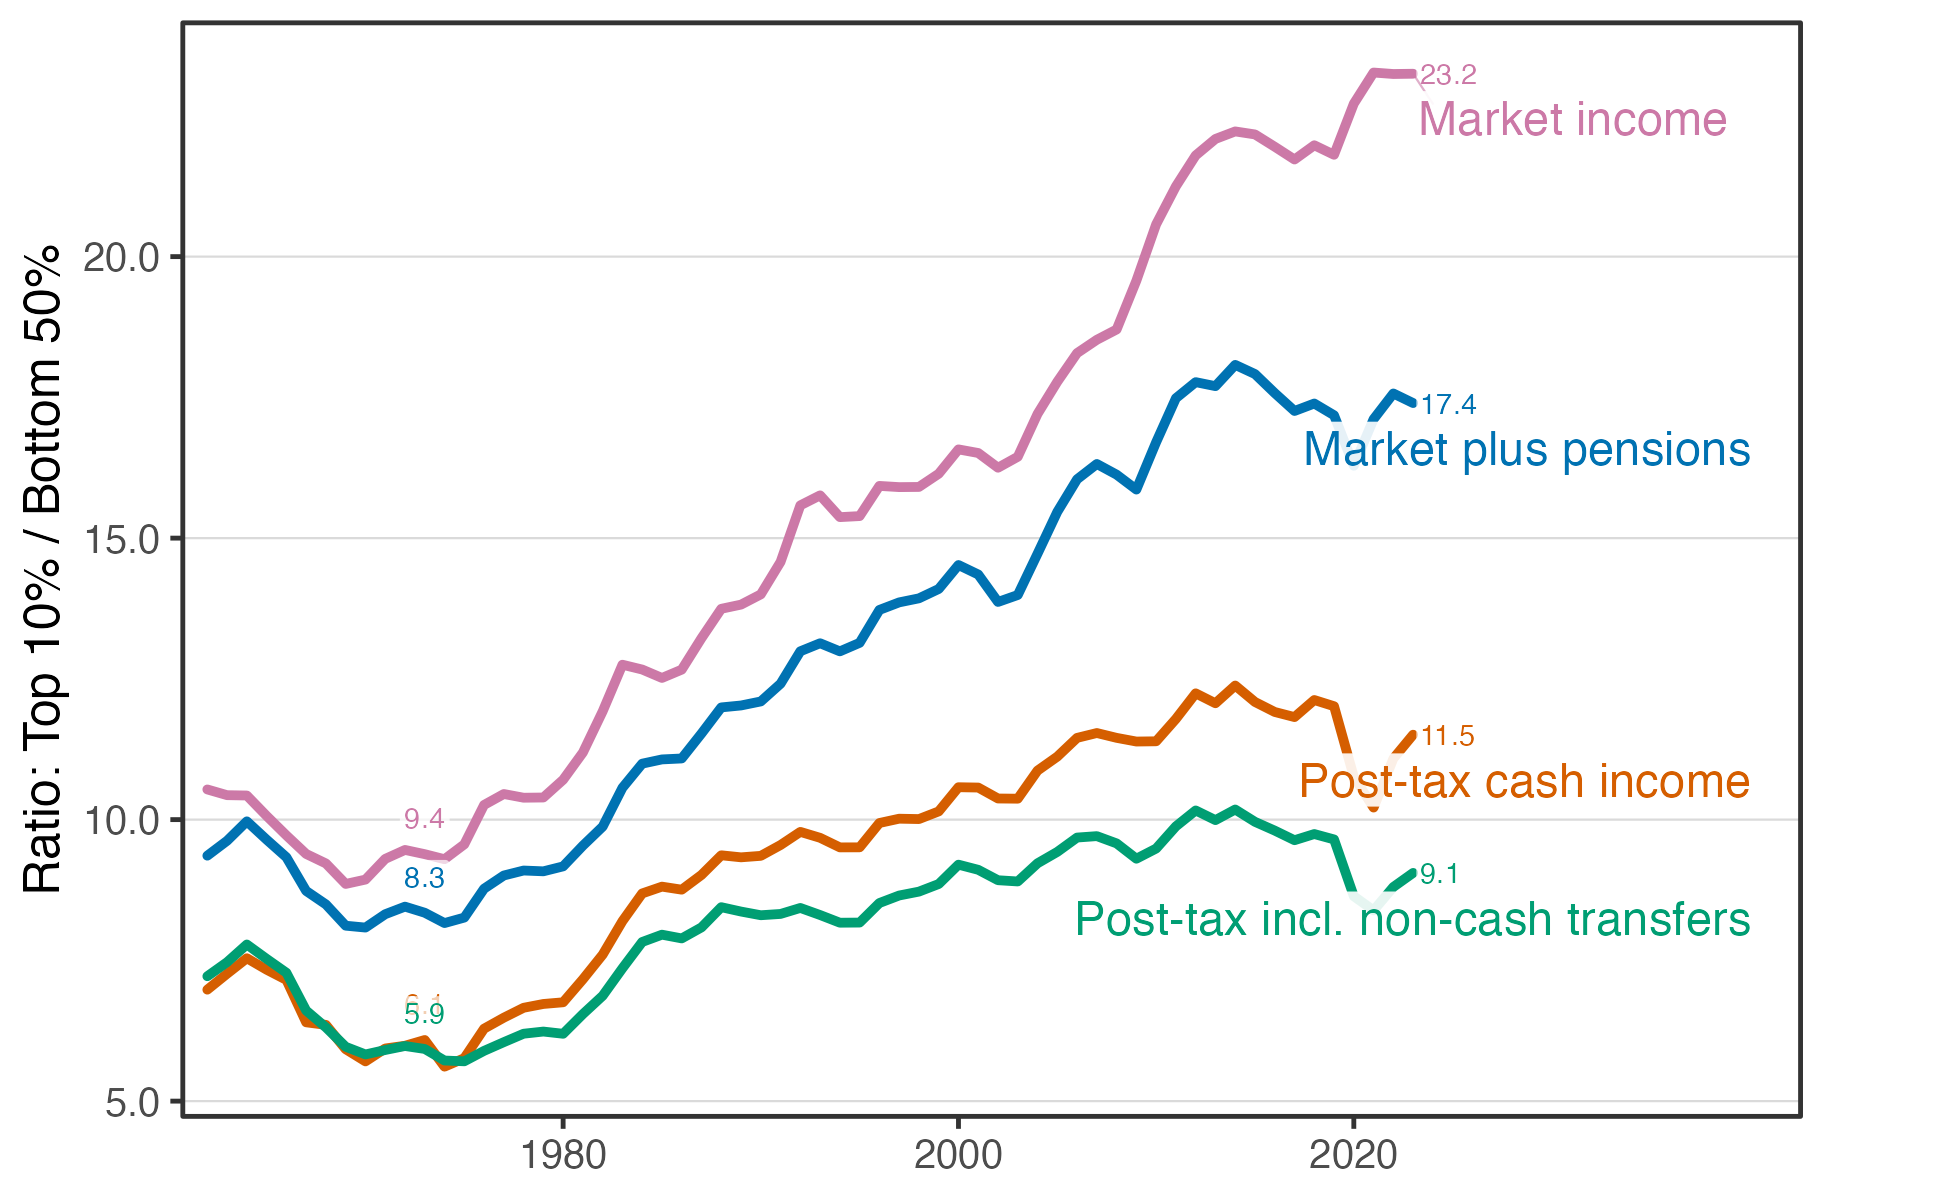
Figure 2 shows that some redistribution does occur in the United States. The ratio of top 10-percent-to-bottom-50-percent posttax incomes is lower than the same ratio for pretax incomes. That is, our tax system does compress the distribution: the top 10 percent’s posttax incomes are “only” ten times higher than the bottom 50 percent’s rather than twenty-three times higher.
This is one simple way to quantify the amount of redistribution in the US: we reduce the pretax ratio from twenty to ten. That is, we cut it in half; this is a 50 percent decrease. We can therefore call the level of American redistribution “50 percent.” Is this a lot or a little? Comparing America with other rich countries can help answer this question.
Inequality and Redistribution Across Countries
In the United States, before taxes, someone in the top 10 percent makes about twenty times as much as someone in the bottom 50 percent. The tax system then compresses this measure in half. Figure 3 compares the US to eighteen other countries on these dimensions.
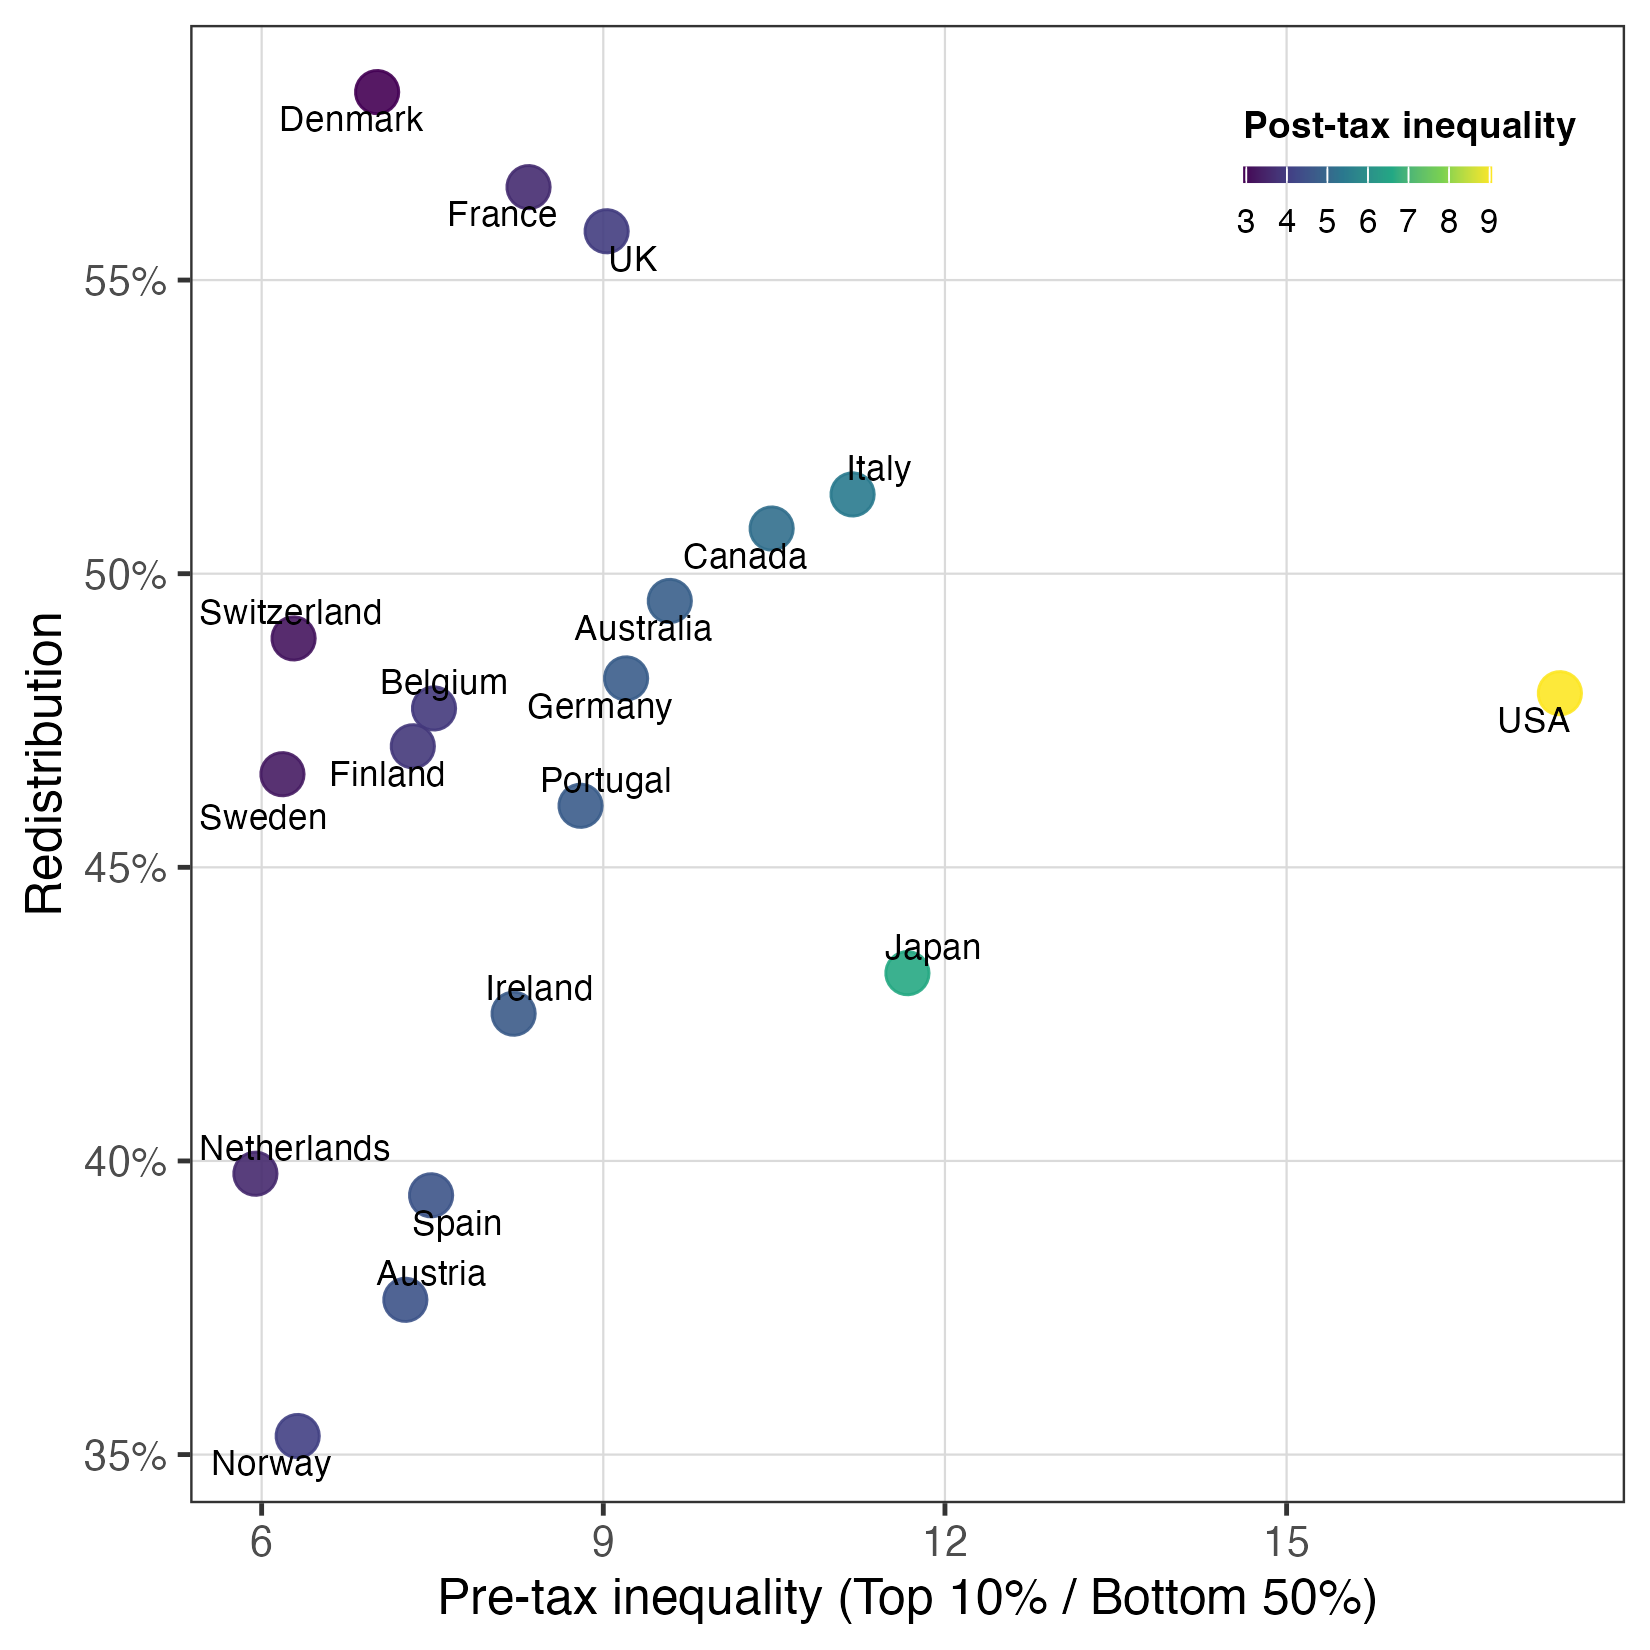
The horizontal axis in Figure 3 plots countries in terms of pretax inequality. (Here I use pretax incomes including pensions.) Countries to the right are those with more unequal pretax distributions. Unsurprisingly, the United States is an outlier. The top 10 to bottom 50 ratios of pretax incomes are far lower in every other rich country than in the US. In most of these places, someone in the top 10 percent makes six to ten times as much as someone in the bottom 50 percent; in the United States, they make almost twenty times as much.
The vertical axis in Figure 3 plots countries in terms of redistribution. Countries higher up do more redistribution, in the sense that they compress the pretax distribution by more. On this measure, the US is solidly in the middle. (For this measure, I use posttax incomes including noncash transfers.)
Finally, the countries are colored according to the posttax inequality that ultimately results from the mix of pretax inequality and redistribution. Economies toward the bottom right of the graph (high pretax inequality and low redistribution) will end up with more posttax inequality; those toward the top left (low pretax inequality and high redistribution) with less. Unsurprisingly, high American pretax inequality isn’t eliminated by “medium-level” American redistribution; the United States has the most posttax inequality as well.
Figure 3 offers an easy way of visualizing predistribution and redistribution side by side. Norway, the Netherlands, Austria, and Spain have relatively low levels of pretax inequality, but they also do relatively less redistribution. Denmark, France, and the UK, in contrast, have both low pretax inequality and do relatively more redistribution. A middle group of continental European countries, Canada, and Australia all have less pretax inequality than the United States but do about the same amount of redistribution.
A hasty but not inaccurate conclusion is that the US is an outlier precisely because of its predistribution of incomes. Our welfare state is surely full of holes and inefficiencies that the Left should focus on remedying. But to reduce inequality, we might need to focus more attention on predistributional forces — that is, on intervening into the workings of American capitalism itself.
What about the rest of the world? Figure 4 zooms out and looks at all countries for which we have data. Countries are colored by their broad region. Rich nations — Western Europe, Canada, Australia, New Zealand, and Japan — all have the lowest pretax inequality and relatively high redistribution. The country closest to the United States is Ecuador; predistribution in the US more closely resembles that of Cuba, Barbados, or Indonesia than it does that of other rich countries.
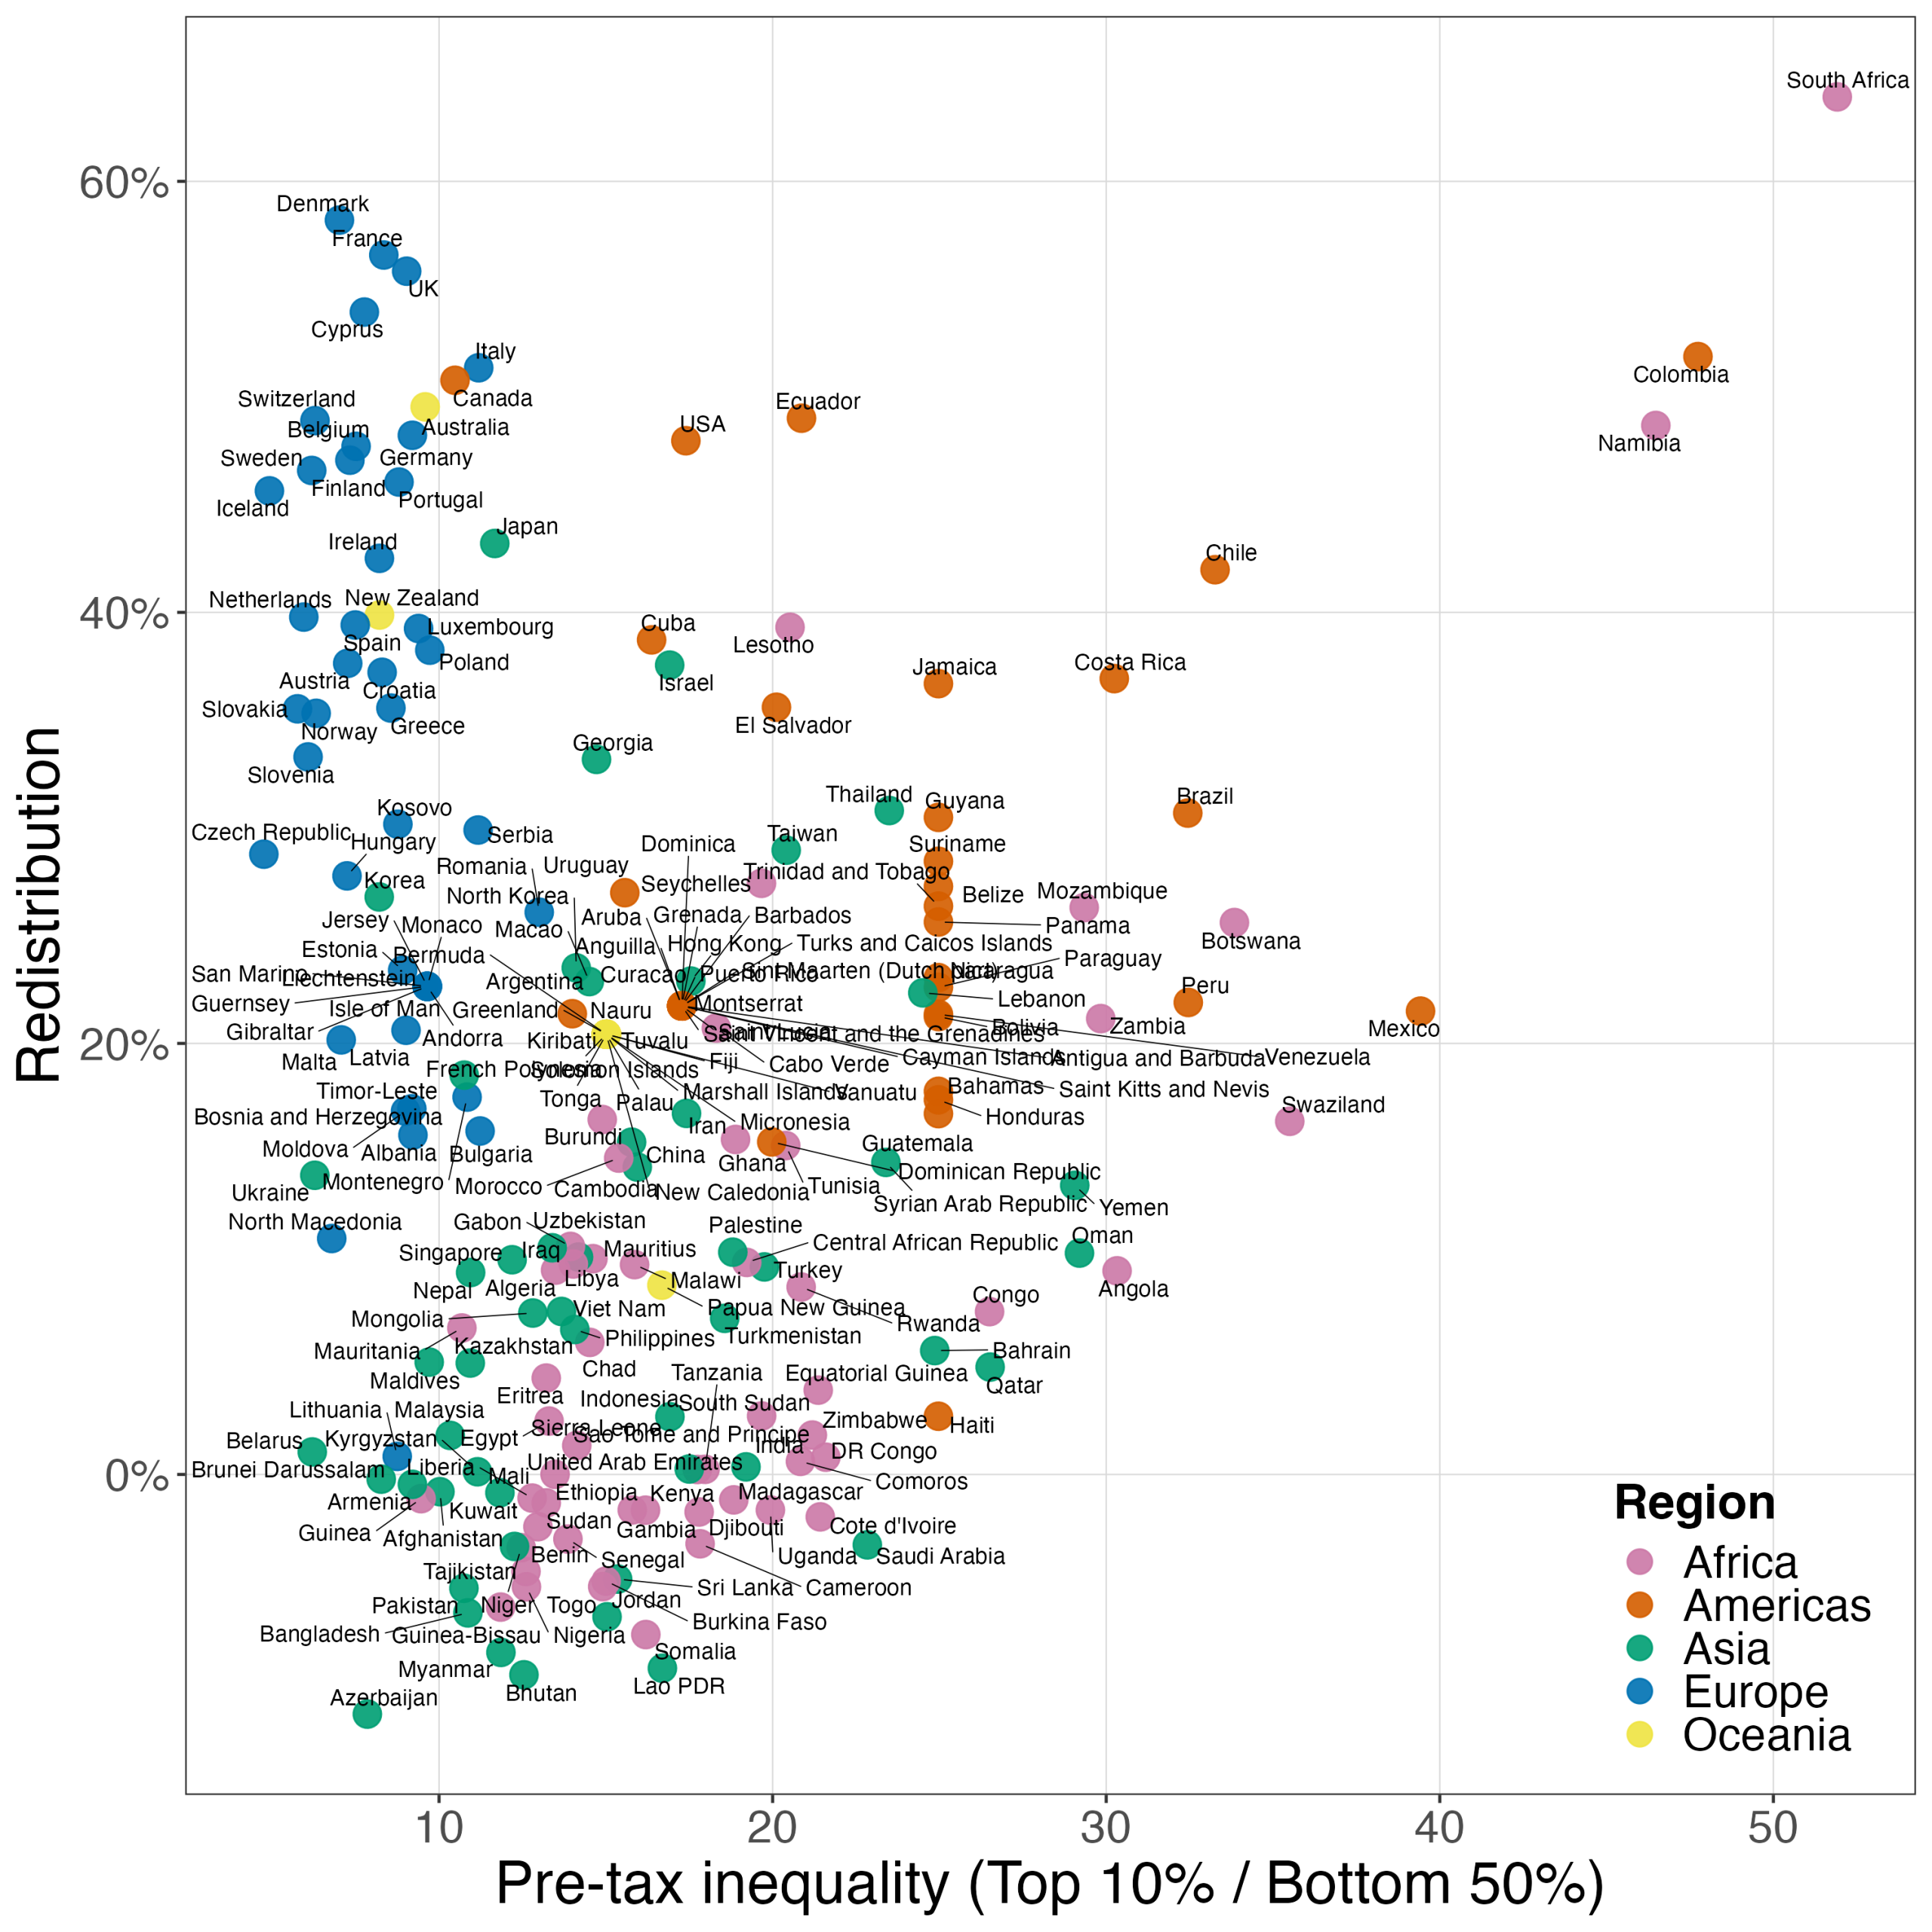
One recent academic paper gives a more complete account of redistribution across the world. Its authors show that, as Figure 4 suggests, richer countries have higher rates of redistribution. They find however that this is entirely due to higher rates of transfers in rich countries, not to more progressive taxes. They also confirm that, indeed, pretax inequality is more important (in an accounting sense) than redistribution in driving posttax inequality.
Predistribution and Redistribution Since 1980
The importance of predistribution of incomes also becomes clear if we look at changes in equality over time. Posttax inequality has increased in many rich countries since 1980. How much of this is due to an increase in pretax inequality rather than a decrease in redistribution?
Figure 5 answers this question. The black dots show increases in posttax inequality, as measured again by the ratio of top-10-to-bottom-50-percent pretax incomes. In the United States, this measure has increased by almost 60 percent since 1980. In many other rich countries, posttax inequality has worsened; Portugal, France, Switzerland, and Spain are the only exceptions.
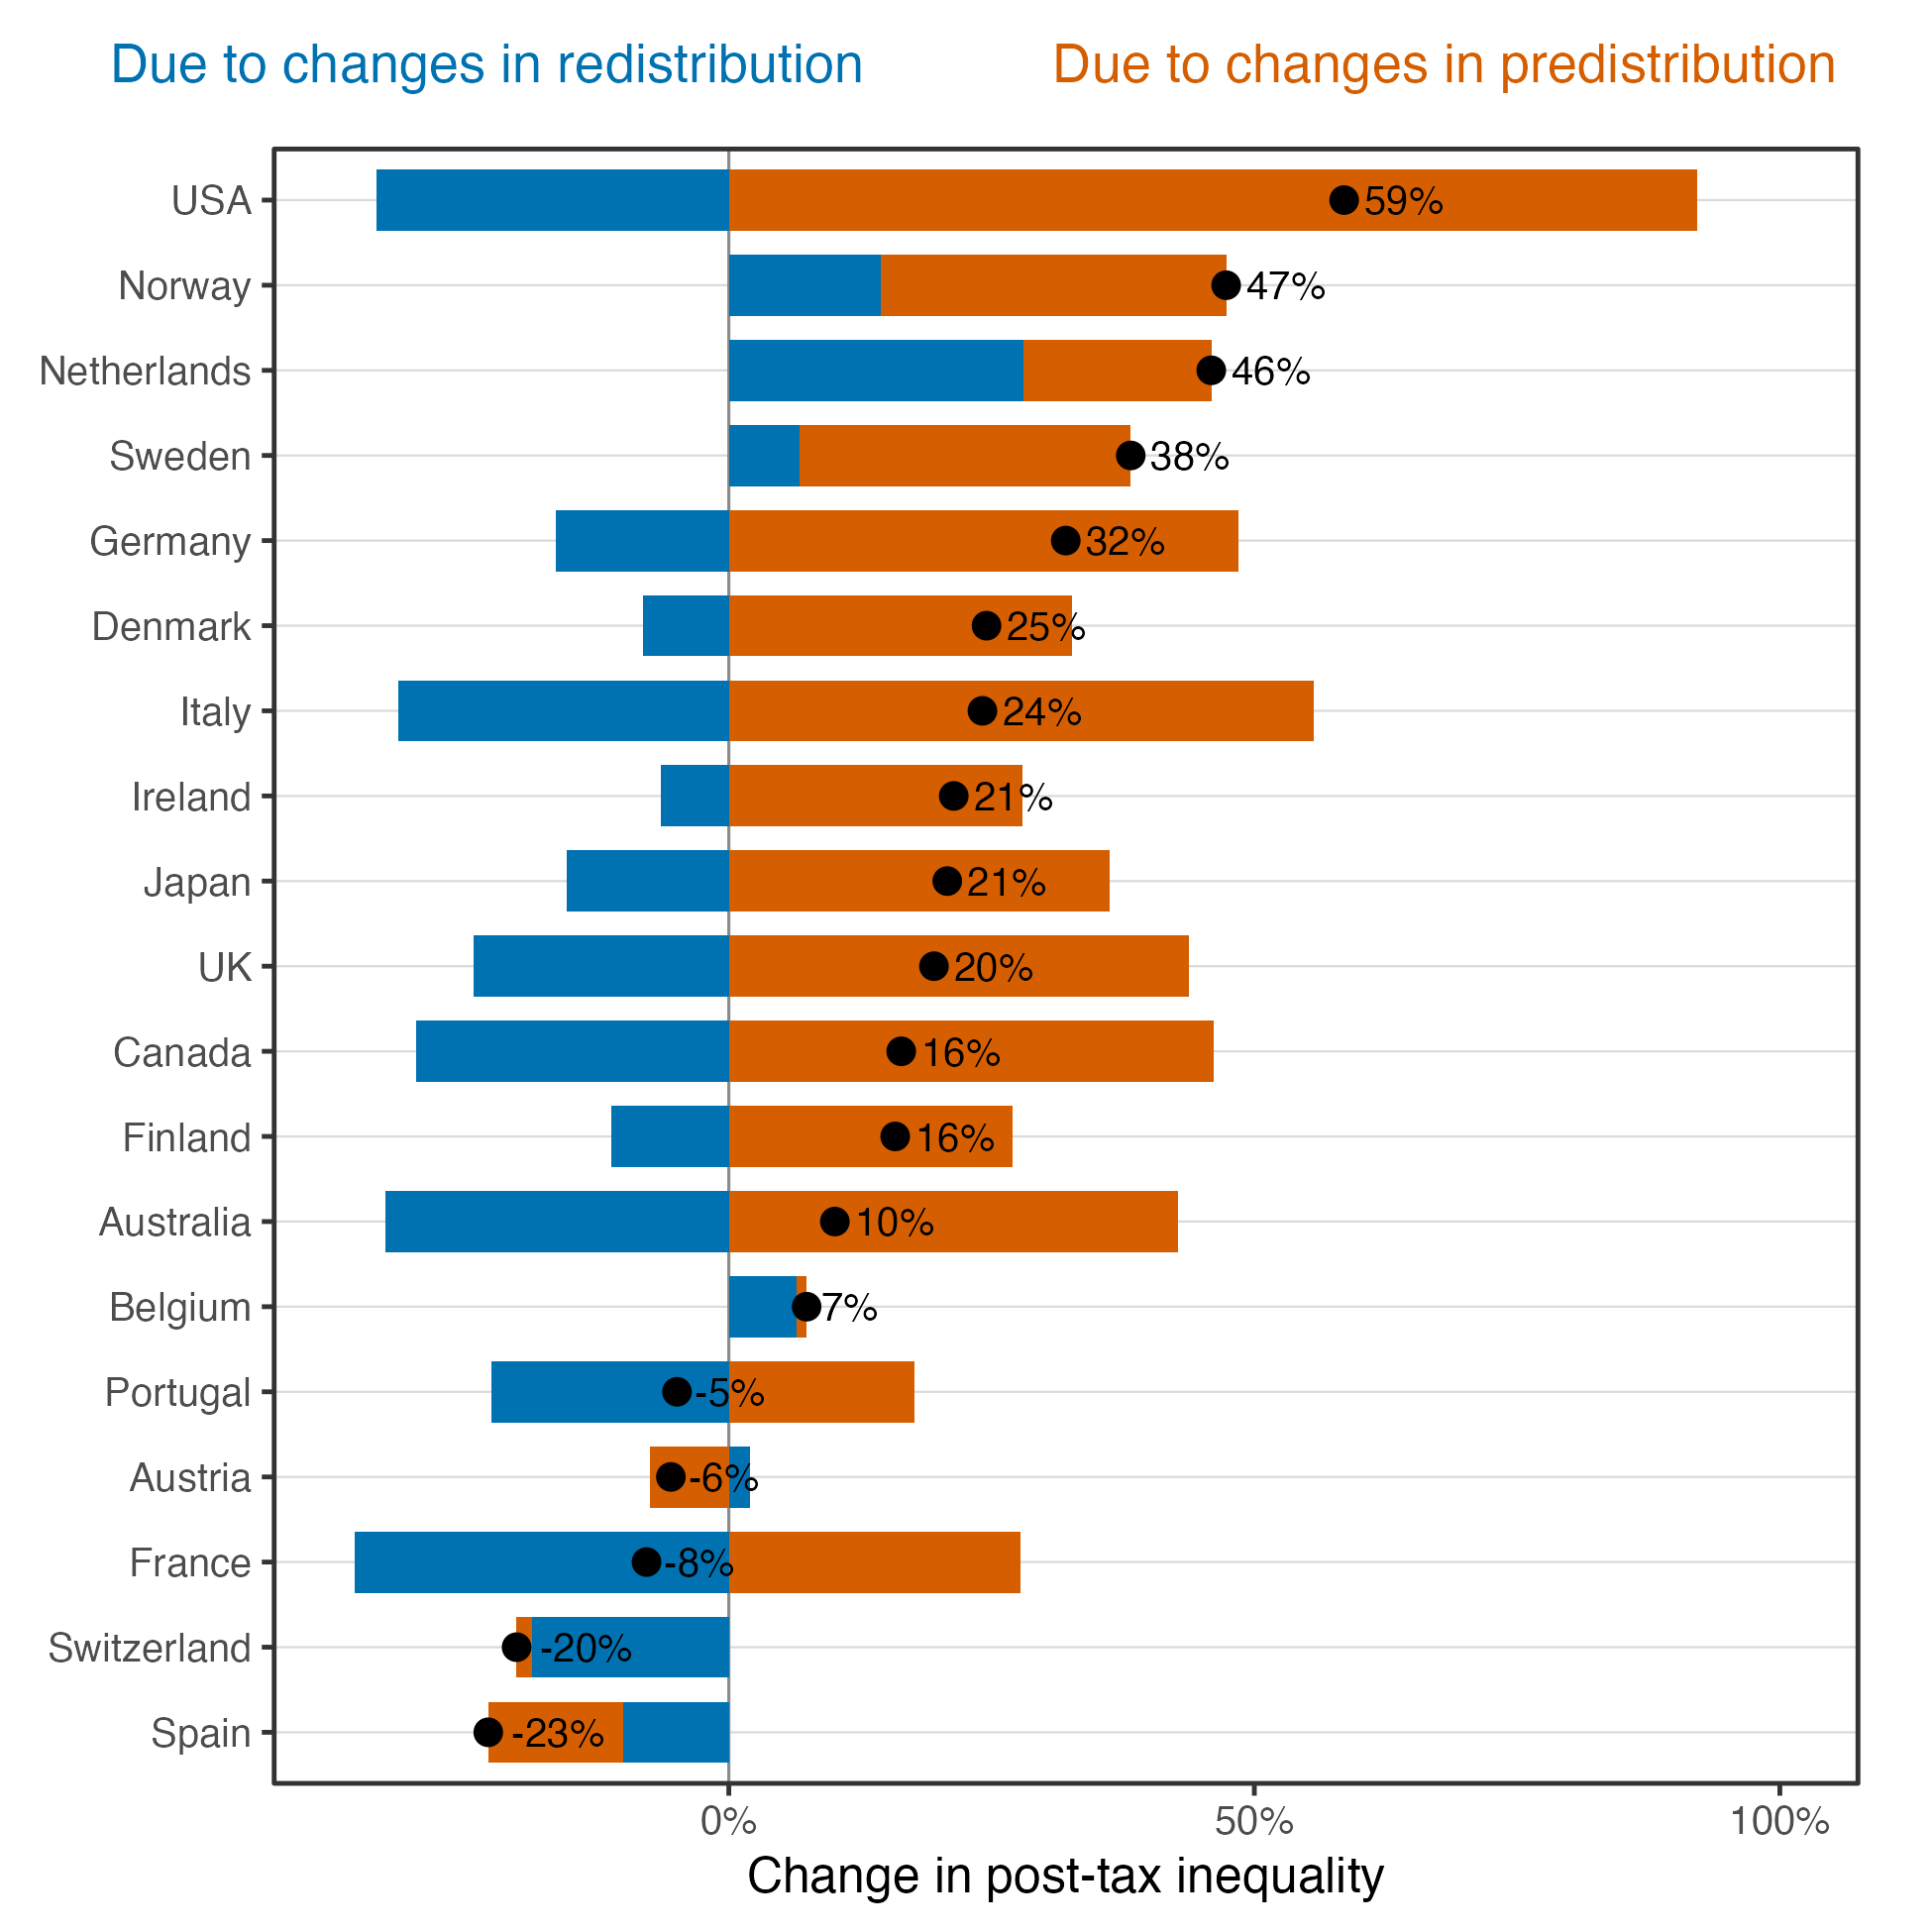
Figure 5 then decomposes this change: How much of it is due to worsening pretax inequality vs. how much is counteracted by increased redistribution? The orange bars to the right are the contribution of worsening pretax inequality. In the US, pretax inequality has almost doubled since 1980. The blue bars to the left show the opposing force of increasing redistribution. In the United States, redistribution has indeed increased since 1980 — but not nearly enough to counteract the massive increases in pretax inequality.
Data for other rich countries looks similar, though less extreme than for the US. Almost all rich countries have increased redistribution since 1980 (the blue bars to the left of zero). Norway, the Netherlands, Sweden, Belgium, and Austria are the notable exceptions (blue bars to the right). In these countries, the tax-and-transfer system has become less progressive since 1980.
Pretax inequality in contrast has gone up almost everywhere. This is offset to varying degrees by increased redistribution. Only Portugal and France have managed to fully counteract increased pretax inequality with increased redistribution. Spain, Austria, and to a small extent Switzerland are the only countries where pretax inequality has fallen since 1980.
Overall, Figure 5 tells a similar story: the United States has increased redistribution since 1980 and has done so at a rate that’s somewhat comparable to other rich countries. The problem is that American redistribution hasn’t kept up with worsening pretax inequality. This suggests, once again, that reducing inequality might require changing the predistribution of incomes.
Looking Ahead
It’s tempting — and I think rather reasonable — to take all of this to mean that the Left should make sure to focus on changing the pre-distribution of incomes. To some extent, this should feel natural. The distinction between predistribution and redistribution feels like one between cause and symptom; if there’s a problem with the predistribution of incomes, redistribution treats that symptom rather than trying to cure the disease. We should certainly be interested in addressing root causes.
Of course, the causality can run in the other direction too. Low taxes allow the rich to influence the predistributional system: they can use their wealth to make campaign donations and lobby politicians to advance their interests. The predistribution of incomes looks the way it does in part because multimillionaires can buy anti-worker policies. If we taxed away some of their money, they wouldn’t be able to. And of course, we can and should improve lots of people’s lives by fixing the holes in our welfare system. Clearly it’s worth thinking about changes on both fronts.
But as I mentioned above, this distinction also matters for winning electoral power. Trump’s electoral coalition is made up at least in part of low-income voters who may be hostile to redistribution but support changing the predistribution of incomes. One academic study shows that this isn’t unique to today. Less-educated voters have consistently shown more support for policies that aim for predistributional fairness. This was true in the 1940s, and it remains so today.
What’s changed is that, since the 1970s, the Democratic Party has turned away from these policies and toward redistribution instead. This shift explains some of the “realignment” of less-educated voters, away from Democrats and toward the Republican Party, ever since Democrats began to make this turn.
Working for predistributional change means intervening into the workings of American capitalism; it also means adopting more broadly popular policies and rhetoric. The Left should take note.